Having an array of result instead of a single Result

Our lab have complex Analysis where the result is an array instead of a single result per analysis. The result from an analysis request in Senaite is given by a single case. We would like to show more than one result directly in the result when reviewing an Analysis instead of having to open the whole test result file.

Also, we would like to have result that are not numbers. I.E. “Pass” or “Fail” mention, Senaite doesn’t seem to allow us to post this kind of result.

Thank you for your time.

Hi DDuguay,

With regards to non-numerical result values (e.g. “Pass” or “Fail”), there are at least two ways to do it. The first is simpler, but not quite as flexible. The way you do it is when you create (or edit) an analysis service, there is a tab labelled “Result Options.” When you select the tab, you can define a mapping from a set of particular numerical values to a set of particular string values. For example, you can specify that a result of 0 should be displayed as “False” and that a result of 1 should be displayed as “True.” As far as I know, this method does not allow you to specify that any result in a particular numerical range should map to a particular string value. For example, you could not define all results greater than 0 to be “Positive.”

This is where the second method comes in. With this method, you use two analysis services to display one result value. The first analysis service will take a numerical value, while the second analysis service will be the result of a calculation based on the first. Using an example from my application, I have an analysis service with the title “Barbiturate Drug Screen (Numerical)” and with the keyword “BarbEIANum.” This analysis service is set to be hidden in reports by default (This behavior can be enabled under the “Analysis” tab when you create or edit an analysis service). My second analysis service is titled “Barbiturate Drug Screen” with the keyword “BarbEIA.” I have this analysis service linked to a calculation with the formula:

"Positive" if [BarbEIANum] > 100 else "Negative"

Thus when I import numerical results from my instruments, the value for BarbEIANum is set to (for example) 112. Since 112 > 100, this triggers the calculation to set the value of “Barbiturate Drug Screen” to “Positive.” The numerical 112 value does not show up in the report, so it all works as if the result was non-numerical to begin with.

I’m afraid I can’t help with the array result, but I hope the above helps.

2 Likes

Hi @DDuguay,

with regards to array results, you might find “Additional values” setting useful. Is available under “Method” tab from “Analysis Service” edit view:

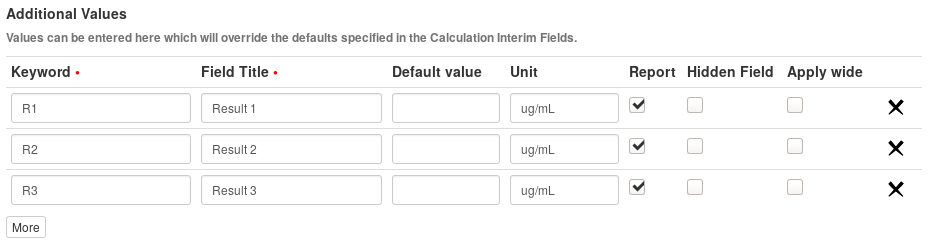
Besides the “Result” column, an additional column for each additional field will appear in results entry view, so user will have to fill all them before being able to submit the analysis. As suggested by @droshan, you can also create a calculation for the result to be set automatically on submit. Calculation also supports “Additional fields”, so instead of using the keyword of another analysis to calculate the result value (“Positive” or “Negative”), you can also make use of the keywords of the “Additional fields” in the formula. Or both other analysis keywords and additional fields depending on the complexity and requirements of your use-case.

Worth to read:

Hope it helps

1 Like

In addition you can bundle a set of single analysis services into an analysis profile or template.
That’s the most flexible way regarding calculations and string results.

BTW services can be set as “string result” instead of numerical anyway.

Hi, I have a similar need. The instrument provides 2500 measurements on a sample. Would be great to assiciate this as the result of the analysis. I would then want to call a r2py function to run my machine learning also to get 15 ‘new’ end results and import these as new analysis results.

Hi Ben,

I’ve also got a similar need but not as ‘insane’ as yours. Typical Measurements are up to 45 elements/oxides and anywhere up to 200 samples per run. I would also like to run calcs on this, i.e. elements to oxides, etc.

I’ve found the current default grid to be a major limiting factor in adoption.

Ideally, I would like to keep data Tidy , where samples = observations and results = variables.

Have you found at any add-ins that change how results entry grid work?